
Materials
QR analytics: the numbers describe a place, not a crowd
Every code is a small beacon you placed in the real world. The statistics do not tell you who people are. They tell you what is happening around that beacon. Read them that way and they start answering questions you can actually do something about.
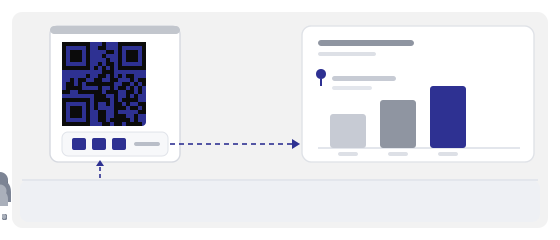
The main idea: you are measuring a place, not an audience
When you look at a scan count, the natural thought is “that many people were interested”. That is not what it means, and it is why most reports end up useless.
A scan is a footprint. Somebody walked up, took out a phone, pointed a camera. You do not know who they were, but you know exactly where the code was, what time it was, and what it was printed on. So you are measuring places and moments.
That is good news, because a place can be changed. You cannot change your visitors, but you can move a sign two metres to the right and see the difference within a week.
Every number on the dashboard answers one of three questions: where the code is, when people see it, and whether it belongs there. Nothing else.
What the dashboard actually shows
With a dynamic code, every scan passes through an address you control. So you see not just the total, but the circumstances around it.
- how many times a camera was pointed at each individual code
- how that count is spread over time — not one figure, but a wave
- peaks by hour and by day of the week
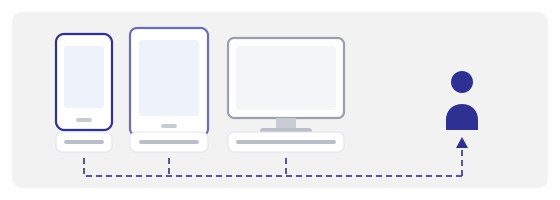
- device type: phone, tablet, computer
- country and city the scan came from
- sudden spikes — usually one particular day with one particular cause
Note one thing: this is all aggregated data. You see “47 scans between 6 and 7 pm”, not “Anna arrived at six”. If somebody promises you names from QR scans, they usually mean people who typed their details into a page you built yourself.
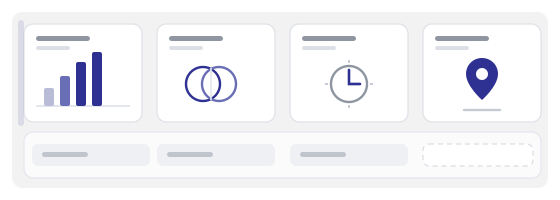
The time column is the most useful, and the most often skipped
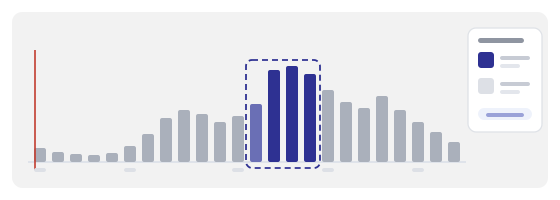
The total gives a feeling of control but explains almost nothing. The spread over hours explains almost everything, because it shows how people physically behave around the code.
A menu code that peaks between seven and nine in the evening means cameras are being pointed at it at the table, after people have sat down. So the menu works, and the sign by the entrance less so. You can redesign that sign forever and the number will not move — you are fixing the wrong object.
A code that comes alive exactly at lunchtime is almost certainly standing where people only are at lunchtime. A code spread evenly across days stands in a fixed spot and quietly does its job.
And if a whole month is one Friday, the material was seen once. Do not draw conclusions about an audience from a single day.
Geography: rough, but honest enough
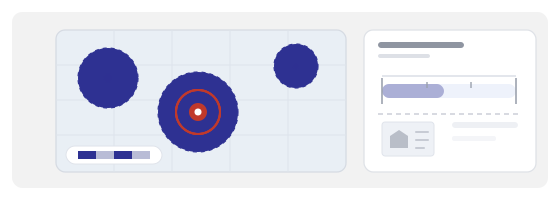
Country and city are worked out from the network, not from satellites. So the data is approximate: someone on a VPN “moves” to another country, and someone roaming may register somewhere they are not standing.
Even so, the pattern stays useful — you do not need a precise address, you need to know whether your material has wandered off somewhere.
The last one pays for itself fastest. A gap between “we paid for this city” and “scans come from somewhere else entirely” becomes an argument with paper behind it instead of a disagreement about feelings.
Devices: a signal about context, not about people
Phones are almost always the majority. That is normal and uninteresting. What matters is the exception, because it tells you how somebody got to the page.
A noticeable desktop share on a code from printed material means one of two things. Either the person scanned and forwarded the link to their own computer. Or somebody typed the address by hand, and that is not a scan at all, even though the dashboard files it as one.
The second case is worth recognising because it quietly inflates your numbers. If a short address is printed in large type on the poster, some people will type it in at home in the evening — and you get “scans” that never happened in front of the code.
Tablets usually mark a specific place: a menu in a venue, a desk in a waiting room, a screen by the door. If tablets turn up where you did not expect them, staff are probably using the code rather than guests.
One code, one place
The most common mistake is a single code for the whole campaign. It gives you one number, and that number describes everything at once, which means it describes nothing.
Give each place its own code: window, till, flyer, packaging, table in the room, stand at an event. Name them so that a month later you still recognise which is which.
Then the important part: compare them over the same period. Two codes that ran in different weeks cannot be compared — you will be comparing the weather, not the material.
One code per place. Otherwise you are measuring the whole business at once and learning nothing you can fix.
A scan is not an action
Here is the trap that makes analytics misleading. A scan only means a phone opened an address. It says nothing about whether the person read to the end, tapped a button, or understood what appeared.
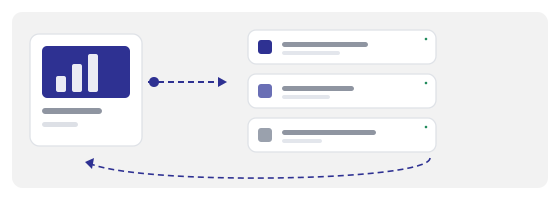
So read two numbers together — scans and what happened next. The second number usually lives somewhere else: in your site analytics, your order system, your booking log. The code dashboard answers “did they arrive”, not “did they do anything”.
An example that makes it obvious. A menu with many scans and few orders. The problem is not the code — they found it. The problem is the menu page: small type, slow loading, prices with no explanation.
And the reverse: few scans in a busy place means nobody noticed the code. Too small, too low contrast, no caption, positioned where eyes do not go. These are two completely different jobs, and confusing them costs money.
Every number should end in a decision
The dashboard is not the result. The result is what you changed after looking at it. If nothing changed after you read the report, you just admired a chart.
So before opening the stats, write down the question. Not “how are we doing”, but “should we print another two thousand flyers” or “is the sign on the second floor working”.
- many scans, few actions → work on the page, not the code
- few scans in a busy place → make the code bigger, add a caption, move it
- scans on one day only → the material is seen once; either accept that or put it where people pass more often
- a steady stream for months → the code works on its own; leave it alone and look at another spot
The first week is a habit, not an assessment
The usual mistake is to open the dashboard after a month, see three hundred scans, and have no idea whether that is good or bad. Without your own baseline, any number looks random.
So the first week is not for conclusions, it is for a habit. Drop in once a day, note the peak hours, and note what you physically did that day: brought new material, hung a sign, published a post.
After seven days you have a baseline — yours, not one from somebody else's article. Now you can compare the following weeks against it and tell whether a change did anything.
And a rule that saves months: change one thing at a time. Moved the sign — leave it alone for a week. Added a caption — another week. If you change everything at once you will never know what worked, and next time you will be guessing again.
When the numbers cannot be trusted
The dashboard does not lie, but it is easy to misread. Here are a few situations where there is a number and no meaning in it.
- you scanned the code ten times yourself while making the mock-up — those scans are yours, not a customer's
- the code is in a window but only readable up close — people point a camera without knowing what is there
- the page loads slowly — some close it before it renders, and you see a scan with no visitor
- the code is shared on social media as an image — scans go up even though nobody scanned anything physical
- the address is printed in large type — some people type it by hand and you get “scans” without a scan
Do not try to clean this up to perfect accuracy — it is impossible. Just remember the number is slightly inflated, and do not base an expensive decision on it.
Where to look at all this
Every dynamic code created here appears in the dashboard with a chart of scans over time, a calendar of peaks, a device breakdown and a map of countries and cities. You can export the data and put codes side by side on one time axis — flyers against posters against packaging.
Creating a code takes a minute in the generator. QR Studio is where the code becomes printed material with the right margins and size. And the QR scanner is how you check the print before you order the run.
One small thing that saves a lot of reports: name codes clearly from the start. “flyer-A4-print-2026-10” still reads fine in six months. “qr7” does not.