
Marketing & analytics
A/B testing two QR posters: what you are actually comparing
Almost every “which poster works better” question gets settled by taste, and taste is expensive: you print a thousand copies of the losing version and find out six months later. The alternative is a real experiment — but the honest version of that experiment is not two posters versus each other. It is two identical situations versus one variable.
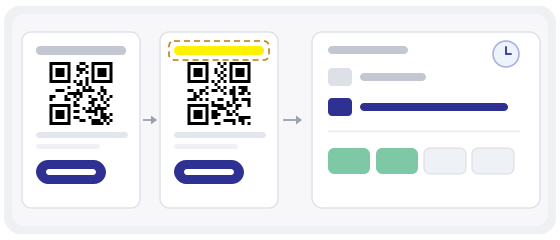
The thing you are testing is not the poster
Put version A by the entrance and version B by the toilets, and the result is already decided: more people walk past the entrance. Put A at eye level and B at knee level and you have measured height, not design. Put A up in July and B up in September and you have measured the season.
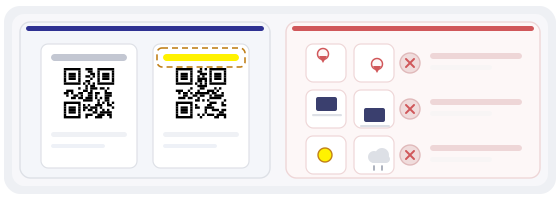
That is why most poster tests produce a confident number and a wrong conclusion. The comparison you can trust is not A against B. It is A against A-with-one-thing-changed, in the same place, at the same time of day, on the same kind of paper.
Four things a fair split needs
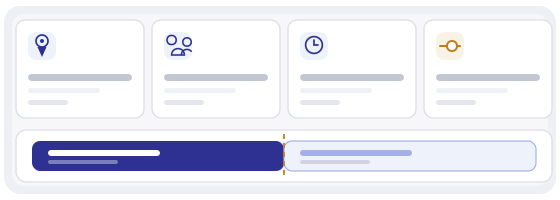
If only one placement exists, use the swap design: A for a week, B for a week, then A again, then B again. Four periods, and you can see whether the difference survives the swap or was just the week.
What to measure instead of scan counts
A scan is not a result. It is the moment someone pointed a camera. What you want is the share of scans that turned into the thing the poster promised: a booking, an order, a completed form, a review.
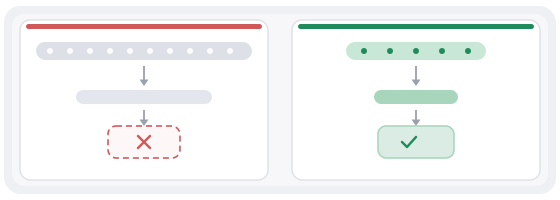
That number is also the one your boss actually cares about, and it has a useful property — it does not grow just because you printed more posters. A hundred scans and no orders is not a win over fifty scans and twelve orders, even though the first column looks bigger.
If you cannot see completions in your analytics, use the next honest proxy: what happened to revenue or bookings in the weeks each version hung, per week, in the same room. Crude, but harder to fool than a scan counter.
Do not decide on day one
The first fifty scans will show a difference, and that difference will be noise. People scan in clumps: a table of six scans the same code, a quiet Tuesday scans nothing. Early numbers look like a trend because there is nothing else on the chart yet.
So decide the rule before you start, in writing: “after four weeks, if B is more than twenty percent better at completions per scan, we keep B”. Writing it down is what stops you from quietly moving the finish line when the version you liked loses.
Three ways the test lies to you
The same code twice
Two visually different posters pointing at the same short link. The analytics merge, and you cannot tell which poster produced what. Each version needs its own destination — two dynamic codes, and a marker in the link that survives the redirect.
Stopping when it looks good
Checking the numbers every morning and freezing the test the day B is ahead. This is the most common way a small test manufactures a winner. The rule has to be set in advance, and the duration has to be fixed before the first scan.
Two codes on one poster
“Let the customer choose” sounds neutral and is not: on a poster, the code on the side people approach wins, and you have measured left-right position rather than message. One poster, one code.
The uncomfortable maths of small numbers
If roughly one in twenty scanners does the thing you want, noticing a ten percent improvement needs thousands of scans per version, not dozens. A café with eighty scans a month cannot resolve that difference, and pretending otherwise produces extremely confident nonsense.
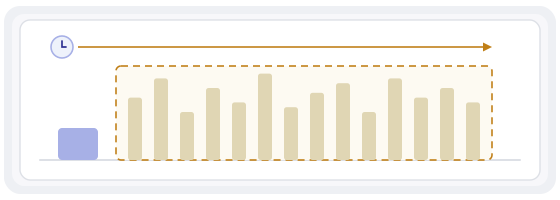
That is not a reason to give up on evidence. It is a reason to spend your effort on the variables with large effects, where a difference shows up in days rather than seasons: where the poster hangs, at what height, and whether there is a line of text at all.
Test in order of effect size
In practice, placement beats size, size beats the sentence, and the sentence beats the colour scheme. Almost nobody believes this, and almost everybody redesigns the colours first.
A sensible order for a small business: is the code where people actually stand and wait? Is it at a height a phone can reach comfortably? Is there one short line saying what happens next? Only then compare wording, and only then compare the design.
Both versions have to work before the test starts
The most wasteful outcome is discovering on day three that one variant scans badly in the actual light of the actual room. Scratched laminate, glare from a window, a code printed too small, a logo eating the quiet zone — any of these turns version B into a code that fails for reasons that have nothing to do with your message.
So test both prints before you hang them: at the distance people really stand, in the light that really exists there, and with a phone that is not the newest one in the building.
Things worth testing before you test anything clever
Not everything needs a controlled experiment, and some changes are so likely to help that you should just make them and keep the measurement for the next round.
Moving the poster from the wall behind the counter to the table where people wait. Adding the plain address under the code so it works for someone whose camera refuses. Making the code bigger by ten millimetres. Replacing a glossy laminate with matte. Removing the second code nobody scans. Each of these is cheap, and each has a bigger expected effect than any colour choice.
What a finished test looks like
One page, four lines: which variable changed, what the destination was for each version, how long each version hung, and what the completion rate was per version. Add one sentence about what you will do differently as a result. If the result was a tie, write that too — a tie that stops a recurring argument is worth more than a fake winner that restarts it next quarter.
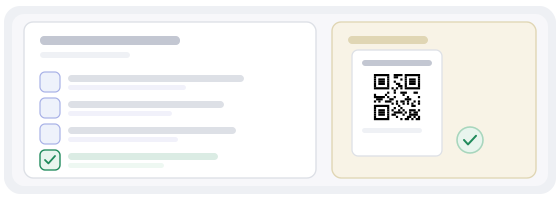
Then keep the losing artwork. In a year the same question will come back, and having the file, the dates and the numbers is the difference between a decision and another opinion.
Common mistakes
- Different texts, different sizes and different places changed in one go, then a conclusion about “the design”.
- Both posters pointing at the same link, so the analytics cannot separate them.
- The test stopped on the morning one version was ahead.
- Two codes printed on one poster and called a split test.
- Comparing a scan count with a completion count and declaring a winner.
- The week-long test that actually compared a sunny week with a rainy one.
How to build the two versions in practice
In the QR generator make two dynamic codes, one per version, and give each its own destination or its own tracking marker — otherwise the whole exercise is decorative. Keep both links in the same account so you can export the numbers side by side at the end.
In QR Studio build one artwork and duplicate it. Change exactly one element — the line above the code, or the size, or the background — and leave the frame, the paper and the mounting height identical, because those are the things your test cannot control for afterwards.
Then check both files with the QR scanner before the print order goes out: scan the printed proof, scan a photo of it, and scan it in the light where the poster will actually hang. A variant that fails here never had a chance to win.